a quick video showing how to add new points to an existing point layer using GPS coordinates, and some discussions
access original video site@ http://www.utipu.com/app/tip/id/16335/
Friday, September 11, 2009
Add Points to Existing Layer from Coordinates
a quick video showing how to add new points to an existing point layer using GPS coordinates, and some discussions
access original video site@ http://www.utipu.com/app/tip/id/16335/
access original video site@ http://www.utipu.com/app/tip/id/16335/
Thursday, September 10, 2009
Blog Site Migration
Due to some of the "difficulties" of using Blogspot.com, I'm migrating this blog over to Wordpress.com service.
Please visit http://zliu95618.wordpress.com/ for future posts.
Thanks!
Please visit http://zliu95618.wordpress.com/ for future posts.
Thanks!
Wednesday, September 9, 2009
SWARS Spatial Analysis, The Book (7)
Create The "Perfect" Boundary...
Off we go now!
I start by bringing in all the 7 input layers (provided in the example data pacaket). The seven layers are:
1. WaterIntake (Point)
2. Invasive (Point)
3. Stream (Line)
4. River (Line)
5. Watershed (Polygon)
6. LandCover (Polygon)
7. DEM (Grid)

We have two existing polygon layers here, the Watershed layer and the LandCover layer. When you zoom in to the coast areas, you will see a lot of these "gaps" as pointed out in this image:

Using either of these two polygon layers as the analysis mask, you will end up losing some data. A compromise? I will use the Union tool to merge these two polygon layers together.

(Shown on the image above)
I know which tool I will use already. So, I just go to Arctoolbox, click the <Index>Tab (at the bottom). Then type in the key word "Union" to locate the tool. Double-click on the already highlighted <Union> tool to launch the function.
Just follow the dialog, using Watershed and Landcover as the two Input Features, I will create a output Feature Class (shapefile) named Land_Union.
Once the tool is run, ArcMap will automatically bring in the output layer. Just color it up using a solid green with no border line and here is what you get:

As you can see, all the "gaps" are now closed and covered!
Next, open the attribute table of this newly created Land_Union layer. Create a new attribute field and name it "LandValue" using Short Integer type. And leave the value as t he default "0". If you want to use any other value, just use the <Field Caculator> tool to assign the new integer value.

Close the table.
I will then use the <Zoom>tools to make a nice and snuggy rectangle just around the Babeldabo area which I will use as my Analysis Extent!
Now, open the Spatial Analyst Option dialog again to set the analysis environment. Click on <Spatial Analyst>menu, then in the drop-down list, click <Options>.

Under <General> Tab, I will
* set my Working Directory to where I want to put all the output layers, and
* use Land_Union as the Analysis Mask.
* for Analysis Coordinate System, select the second option and use the active data frame's coordinate system.
(*** the data frame's coordinate system is defined by the first data layer you brought into the frame!!!)
In<Extent> Tab,
* set the Analysis Extent to "Same as Display" (choose from the drop-down list), then
* set the Snap Extent to the DEM layer (dem_nad83).
Finally, under<Cell Size> Tab, |
* set the Analysis Cell Size to "Same as Layer "dem_nad83".
With the Analysis Environment set, we are ready to push forward!!
|
Highlight the Land_Union layer by click on it in the Table of Content (TOC).
Click <Spatial Analyst>again, choose <Convert>, then <Features to Raster...>.
The Features to Raster dialog will now open. If you highlighted the Land_Union layer first, it should be selected as the Input Features already. If you didn't, no worries either. Just select it use the drop-down list.
Choose "LandValue" as the Field from the list.
Output Cell Size should already be 10. |
In the last option, I will name the output raster as Land_Union_R (with the R for "Raster"). Hit OK!
When it's done, we now have our "Perfect Boundary/Background" which is already defined to the most efficient spatial extent (try use the zoom to layer tool and see where it goes), with the right project and cell size, all thanks to the previous setting of the Analysis Environment!! | 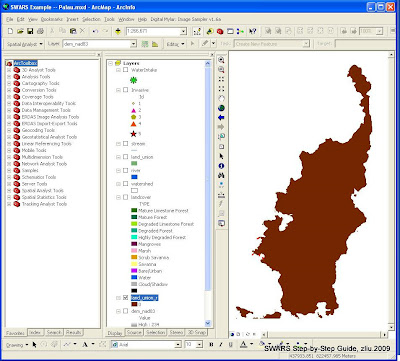
Off we go now!
I start by bringing in all the 7 input layers (provided in the example data pacaket). The seven layers are:
1. WaterIntake (Point)
2. Invasive (Point)
3. Stream (Line)
4. River (Line)
5. Watershed (Polygon)
6. LandCover (Polygon)
7. DEM (Grid)

We have two existing polygon layers here, the Watershed layer and the LandCover layer. When you zoom in to the coast areas, you will see a lot of these "gaps" as pointed out in this image:

Using either of these two polygon layers as the analysis mask, you will end up losing some data. A compromise? I will use the Union tool to merge these two polygon layers together.

(Shown on the image above)
I know which tool I will use already. So, I just go to Arctoolbox, click the <Index>

Next, open the attribute table of this newly created Land_Union layer. Create a new attribute field and name it "LandValue" using Short Integer type. And leave the value as t

I will then use the <Zoom>
Now, open the Spatial Analyst Option dialog again to set the analysis environment. Click on <Spatial Analyst>

* set my Working Directory to where I want to put all the output layers, and
* use Land_Union as the Analysis Mask.
(*** the data frame's coordinate system is defined by the first data layer you brought into the frame!!!)
In
* set the Analysis Extent to "Same as Display" (choose from the drop-down list), then
* set the Snap Extent to the DEM layer (dem_nad83).
Finally, under
* set the Analysis Cell Size to "Same as Layer "dem_nad83".
With the Analysis Environment set, we are ready to push forward!!
Click <Spatial Analyst>
The Features to Raster dialog will now open. If you highlighted the Land_Union layer first, it should be selected as the Input Features already. If you didn't, no worries either. Just select it use the drop-down list.
Choose "LandValue" as the Field from the list.
Output Cell Size should already be 10.
In the last option, I will name the output raster as Land_Union_R (with the R for "Raster"). Hit OK!
When it's done, we now have our "Perfect Boundary/Background" which is already defined to the most efficient spatial extent (try use the zoom to layer tool and see where it goes), with the right project and cell size, all thanks to the previous setting of the Analysis Environment!!

Tuesday, September 8, 2009
SWARS Spatial Analysis, The Book (6)
*Go to ArcGIS Desktop Help, read as much as you can find about Spatial Analyst and Raster Analysis Environment Settings.
Turn on the Spatial Analyst
First thing first! For this SWARS analysis, the most important group of ArcGIS functions is in the Spatial Analyst Extension. So, make sure you even have that extension!
To get the ArcMap Spatial Analyst toolbar out, if you have the extension installed and licensed:
1. in ArcMap, click the
2. select
3. in the Extensions dialog, check on the Spatial Analyst extension
4. then, click the
5. select
6. check the Spatial Analyst option
You should now see the Spatial Analyst toolbar on your main ArcMap interface.
If you don't see the Spatial Analyst option, that means you don't have that extension for your ArcGIS. You will need some extra help getting it solved.
Now, here are a few very important concepts which we will apply but you might not have paid enough attention to before.
* Analysis Mask
* Analysis Extent
* Snap Raster
* Cell Size
Ding! Ding! Ding! Any bell rings?? If not, you should and can find all the explanations you need in ArcGIS Desktop Help. Just go into the Help and type in those key words to find them. I will explain a bit more when we get to them.
Get familiar with these key concepts first. It's worth the time!!
**ArcGIS Desktop Help is your first and perhaps one of the best places to go for information on how to use ArcGIS! Get used to it!
Now you should see the Spatial Analyst toolbar on your main ArcMap interface. Click on
The raster analysis Environment Settings dialog box will appear as shown here.

This is where you do it once and save a whole lot of time later.
As I said during the Hawaii SWARS Workshop, ideally, we would have a boundary polygon (Analysis Mask) that encompasses precisely all and only the areas we will be analyzing, which itself is so well defined within such a "snuggy" rectangle (Analysis Extent)! Should such a national treasure exist, all shall be easy. We can just use it for all our raster analysis environment settings.
Unfortunately, many of us don't score that lottery. Therefore, we are likely required to "create" it! This is where it gets interesting and creativity shall shine.
Case Example
For our Palau exercise, we will:
* limit our Analysis Extent to the Babeldabo island;
o you want the Analysis Extent to be as small as possible;
* snap all rasters to the existing DEM grid; and
o use one of your existing rasters as the snap raster;
* set our output raster cell size to the same as the DEM grid, 10 by 10 meters.
o 10 by 10 feels about right for the size of most of the islands.
Again, it's up to you to determine exactly how to set those parameters!
Thursday, September 3, 2009
Slow down my ranting
The techy part of this BOOK should supposedly be the easiest part for me, because that's what I do. I joked all the time during our workshops, that I can finish a SWARS for pretty much any of the islands in a couple of hours, from start to finishing the metadata. That "joke" wouldn't be too far off from the truth. But, often times, however, explaning what you are good at to a wider audience is a lot more difficult than it looks.
We simply take too much for granted for what we are familiar with. Sometimes, when I ask my firends working in the valley for help, I just have to tell them to slow down. There is nothing embarrasing about that.
12 years of expeirence does make a difference. For 12 years I have been using GIS software, especially the ESRI product. That sometimes makes me think too easily that everybody should just already know something in ArcGIS, which of course is not true. Slowing it down is always good.
To prepare this exercise, I have run the analysis a couple of times already, trying various options and combinations. Remember, I keep emphasizing that there are almost always multiple choices to accomplish a task in ArcGIS and there is often no right or wrong chosing any. So, the procedure I present here is what I think is appropriate and perhaps more importantly, smooth.
Videos will be made available to accompany the document. Nothing is more effective, when it comes to learning how to use a software, than simply watching others do it.
Wednesday, September 2, 2009
Download the Palau SWARS Example Data
If you want to follow exactly how The Book runs through the Palau example analysis, download the data packet here.
SWARS Spatial Analysis, The Book ( Case Example )
Since we are getting into the hands-on dirty techy stuff, we'd need an example to run on. Data provided by our partners from the PALARIS office in Palau will be used. Special thanks to PALARIS!
The Issue
The "ISSUE" for the sample analysis is defined as "protect and improve water quality". When all processes are run, the final priority map will show the important areas where forestry grograms can better help to protect and improve the water quality for Palau and its population.
The Input Layers
These are the six input layers and their weights:
It's pretty straightforward that the Priority Watershed layer is ranked the highest for our case issue. The Land Cover layer is ranked right up there too because it provides an array of critical attributes regarding water quality. It identifies where the critical land cover types are, e.g. wetlands and forests. You can also extract wildfire risk from it. Obviously, the river and stream systems are important (these two usually are combined in one layer). The Invasive species layer reveals an significant aspect of the forest health. It is also used to demonstrate how to use a point source layer. Slope, well, at least it tells you the level of difficulty to operate.
Satisfactory? Maybe not as much as I prefer, but good enough perhaps for the purpose of demonstrating the process.
The RCV Classificationon Scheme
A RCV Scheme of 1 to 10 step by 1.
** Please note!!! The Palau case example used here is only for the purpose of going through the GIS techniques. It is NOT an actual SWARS project. Layers selection is mostly based on data availability. The Invasive Species point data is created by the author and not an actual layer!!
The Issue
The "ISSUE" for the sample analysis is defined as "protect and improve water quality". When all processes are run, the final priority map will show the important areas where forestry grograms can better help to protect and improve the water quality for Palau and its population.
The Input Layers
These are the six input layers and their weights:
- Priority Watershed; (polygon); 25%
- Land Cover Types; (Polygon); 25%
- River; (Line); 15%
- Stream (Line); 15%
- Invasive Species*; (Point); 15%
- Slope; (Grid); 5%
*Unlike the other five, the Invasive Species layer is not an actual dataset but created by the author to demonstrate how can a point layr be used creatively.
Not to be forgotten is an good explanation why these layers are used and used as such. So, here is my "why":It's pretty straightforward that the Priority Watershed layer is ranked the highest for our case issue. The Land Cover layer is ranked right up there too because it provides an array of critical attributes regarding water quality. It identifies where the critical land cover types are, e.g. wetlands and forests. You can also extract wildfire risk from it. Obviously, the river and stream systems are important (these two usually are combined in one layer). The Invasive species layer reveals an significant aspect of the forest health. It is also used to demonstrate how to use a point source layer. Slope, well, at least it tells you the level of difficulty to operate.
Satisfactory? Maybe not as much as I prefer, but good enough perhaps for the purpose of demonstrating the process.
The RCV Classificationon Scheme
A RCV Scheme of 1 to 10 step by 1.
** Please note!!! The Palau case example used here is only for the purpose of going through the GIS techniques. It is NOT an actual SWARS project. Layers selection is mostly based on data availability. The Invasive Species point data is created by the author and not an actual layer!!
Tuesday, September 1, 2009
Island Imagery Available (August 2009)
Let's get away from the boring "book" for a while and take a look at what imagery we have for the islands as of today. Here is an update.
*********************************************************************************
· Latest update
o Kosrae (FSM) Pan-sharpened Natural Color QuickBird; August 2008 from Tony Kimmet (NRCS)
o Kosrae (FSM) Pan-sharpened Color-Infrared QuickBird; August 2008 from Tony Kimmet (NRCS)
o Manu’a group (American Samoa) Pan-sharpened Natural Color QuickBird; August 2008 from Land Info (direct purchase).
o Manu’a group (American Samoa) Pan-sharpened Color-Infrared QuickBird; August 2008 from Land Info (direct purchase).
· All Archive Imagery Available
Island Imagery Available
Guam IKONOS; QuickBird
CNMI IKONOS; QuickBird
Palau QuickBird
American Samoa QuickBird
Federated States of Micronesia QuickBird
Republic of the Marshall Islands QuickBird
Hawaii QuickBird
· Data Distribution Status
o All archive image data have been distributed to corresponding islands/sates with the latest transfer provided as part of our workshop materials.
o The new Manu’a group QuickBird has been provided to American Samoa.
SWARS Spatial Analysis, The Book (5)
Design Raster Class Value Classification Scheme...
OK! By now, you supposedly have defined the issue, chosen the input layers, and assigned the layer weights. It's finally time to get into the GIS thingy!

* The Scream by Edvard Munch, 1893
No, no, no. No need to scream. Take it easy! All will be just fine.
Start the engine...
Your input layers are likely to exist in all kinds of GIS data types, polygon vector, line vector, point vector, or raster grid, etc. But our final model takes only one data type -- Raster Integer Grid. That means, there is a lot of work to be done just to get the input layers ready. For those of you who attended our Hawaii SWARS Workshop, you would probably agree with me that this part of the project -- to get the layers ready -- is perhaps the most "difficult" part for us, the GIS specialists.
We start this long journey with the Raster Class Value (RCV) Classification Scheme.
Whatever type the original data is, we need to "transform" it into an Integer Grid, because that's what the final model requires. A weighted overlay basically is to sum up the weighted values of coincident pixels from all input layers. A pixel is a square unit that represents a specific area on the ground. If we consider each input layer as a factor/element/feature in the overall analysis, a pixel will carry a unique value for each factor (layer) that represents the value of that particular area for that factor (layer).
Note that we actually have two weighting/ranking processes through this project.
First, we rank and assign weights to each input layers based on their relative importance to the analysis.
Then, we rank and assign values to each pixel/area of land within each input layer.
All lands should not be treated as the same because of their locations. Neither should the same land be looked at as the same depending on what you are looking for. A remote wildness area is probably much more attractive if you are searching for natural beauty compared to a downtown center. But the same wildness area is not likely to be your first choice for a new elementary school or shopping center. Simple, right?
The RCV Classification Scheme is applied to the relative value of each pixel within a input layer. Again, all lands should not be treated as the same depending on their location. Say we are looking at the watershed layer. Some watersheds are significantly more important than others because they supply water to the public drinking system. Hence, we are assigning higher values to the land within these priority watersheds. A question presents. What is the value?
Well, I guess that's why we need to establish a RCV Scheme first.
If you have done the Spatial Analysis Project (SAP), you would know already that for SAP, it's a binary value system. So, the pixel value will be either 0 or 1, very simple. In fact, if you want, you could use the same binary value system for SWARS. Some states indeed are doing so. However, that choice would not be my recommendation.
I suggest a wider value range than what you absolutely need. For example, if the maximum number of values you need is 5 (1~5), then use a value systems than provides a range of 10 (1~10). Remember, you do not have to actually use all the values available! But one thing I will remind again, make sure you do use the Maximum value for each layer! You must not unconsciously mixed in a layer ranking here when you are supposed to only rank the land within a layer.
Say if you have a RCV scheme of 1 to 10. For layer A you used values 10, 8, 5, 3, 1. But for layer B, you used 7, 4, 2. In this example, you already have a 10 to 7 weighting ratio against layer B!! Leave that to your layer weights!!
Again, two points to take from the example above. First, you do NOT have to use up all the values available in the RCV scheme. Two, you should/must employ the maximum value in the RCV scheme for each input layer.
Oh, one more thing which I also repeatedly advocated in our Hawaii Workshop, do NOT use the value 0! There are multiple reasons why I say that especially coming from a long history of using software like ERDAS. One reason you will see later on.
Case Example
So, for our case example of Palau, I will use a RCV scheme of 1 to 10 step by 1.
OK! By now, you supposedly have defined the issue, chosen the input layers, and assigned the layer weights. It's finally time to get into the GIS thingy!
* The Scream by Edvard Munch, 1893
No, no, no. No need to scream. Take it easy! All will be just fine.
Start the engine...
Your input layers are likely to exist in all kinds of GIS data types, polygon vector, line vector, point vector, or raster grid, etc. But our final model takes only one data type -- Raster Integer Grid. That means, there is a lot of work to be done just to get the input layers ready. For those of you who attended our Hawaii SWARS Workshop, you would probably agree with me that this part of the project -- to get the layers ready -- is perhaps the most "difficult" part for us, the GIS specialists.
We start this long journey with the Raster Class Value (RCV) Classification Scheme.
Whatever type the original data is, we need to "transform" it into an Integer Grid, because that's what the final model requires. A weighted overlay basically is to sum up the weighted values of coincident pixels from all input layers. A pixel is a square unit that represents a specific area on the ground. If we consider each input layer as a factor/element/feature in the overall analysis, a pixel will carry a unique value for each factor (layer) that represents the value of that particular area for that factor (layer).
Note that we actually have two weighting/ranking processes through this project.
First, we rank and assign weights to each input layers based on their relative importance to the analysis.
Then, we rank and assign values to each pixel/area of land within each input layer.
All lands should not be treated as the same because of their locations. Neither should the same land be looked at as the same depending on what you are looking for. A remote wildness area is probably much more attractive if you are searching for natural beauty compared to a downtown center. But the same wildness area is not likely to be your first choice for a new elementary school or shopping center. Simple, right?
The RCV Classification Scheme is applied to the relative value of each pixel within a input layer. Again, all lands should not be treated as the same depending on their location. Say we are looking at the watershed layer. Some watersheds are significantly more important than others because they supply water to the public drinking system. Hence, we are assigning higher values to the land within these priority watersheds. A question presents. What is the value?
Well, I guess that's why we need to establish a RCV Scheme first.
If you have done the Spatial Analysis Project (SAP), you would know already that for SAP, it's a binary value system. So, the pixel value will be either 0 or 1, very simple. In fact, if you want, you could use the same binary value system for SWARS. Some states indeed are doing so. However, that choice would not be my recommendation.
I suggest a wider value range than what you absolutely need. For example, if the maximum number of values you need is 5 (1~5), then use a value systems than provides a range of 10 (1~10). Remember, you do not have to actually use all the values available! But one thing I will remind again, make sure you do use the Maximum value for each layer! You must not unconsciously mixed in a layer ranking here when you are supposed to only rank the land within a layer.
Say if you have a RCV scheme of 1 to 10. For layer A you used values 10, 8, 5, 3, 1. But for layer B, you used 7, 4, 2. In this example, you already have a 10 to 7 weighting ratio against layer B!! Leave that to your layer weights!!
Again, two points to take from the example above. First, you do NOT have to use up all the values available in the RCV scheme. Two, you should/must employ the maximum value in the RCV scheme for each input layer.
Oh, one more thing which I also repeatedly advocated in our Hawaii Workshop, do NOT use the value 0! There are multiple reasons why I say that especially coming from a long history of using software like ERDAS. One reason you will see later on.
Case Example
So, for our case example of Palau, I will use a RCV scheme of 1 to 10 step by 1.
Wednesday, August 26, 2009
SWARS Spatial Analysis, The Book (4)
Select, Rank, and Weigh The Input Layers...
Now let's talk cooking!!
Of course that was a joke! However, similarities are there between cooking and our spatial analysis for SWARS. When cook, you don't just throw in all the ingredients you can find in the kitchen or use whatever quantities as you like. You choose the ingredients carefully and measure the quantities with perhaps even more caution, all depending on the dish you are trying to make. If you are making a Kung Pao Chicken, you wouldn't dump in 5 lbs of beef, would you? The same applies to the SWARS spatial analysis or any other spatial analysis for that matter. Input data layers are to be deliberately selected. For a weighted overlay modeling like SWARS, determining the layer rankings and weights requires much discussion and debate. And this, is where the participation of all your partners, stakeholders, and experts in the specific area really comes in.
We spent a lot of time during our Hawaii SWARS Workshop practicing how to conduct such a discussion session. The end goal is to find the right input layers and their relative significance (weight) for analyzing the issue in question. More layers is not necessarily always better. Selecting the right input combination, however, is. Please don't be tempted to put in all the stuff you got, for this is not a showing off of how abundant your data collection is.
For each layer selected, the "why" has to be asked! Why does it make sense to include that particular layer? What unique information does it contribute to the issue? How important is this data relative to the others? Where does it stand in the full selection of layers? What is the appropriate weight should it have? And then, how should it be used? All questions might not be easy but have to be answered.
Once again, let's resort to the Texas Report. This is how it describes the layer selection for the issue "Reduce the impacts of land-use change, fragmentation, and urbanization on forest landscapes":
...The Development Level layer received the greatest weight (40%) because housing density changes represent the primary force of change acting on forestland (20%). The forest patch layer is included (20%) to add priority for forest tracts larger than 500 acres, since the effect of development on these lands is fragmentation. Protected Areas, or Proximity to Public Land, confers a measure of priority (10%) because private lands between city boundaries and protected public lands could provide "green infrastructure" connections between natural areas and nearby cities...
*source: Texas Satewide Assessment of Forest Resources, Draft, September 26, 2008. p79
You, as the GIS specialist, not only should be present at these discussions, but also need to be actively participating. For the "non-GIS" experts to be fully mobilized, you have to help them understand the basic spatial analysis process. For example, a point source data can be easily buffered to create areal representations thus to be incorporated into the "overlay" modeling. Disagreement is likely to be inevitable but that is quite OK. Compromise shall be reached with all voices being considered.
Tuesday, August 25, 2009
SWARS Spatial Analysis, The Book (3)
Define The Issues...
There was a joke floating happily around the classroom during our Hawaii workshop after everybody got to actually run through the modeling process and saw some results. It said, after you ran the final model, if the map didn't come out as you had expected (base on the issue you defined), just go back and "re-define" your issue to match the map, and all will be just fine. Hey, that would be an EXCELLENT solution!
Seriously now.
The SWARS Spatial Analysis for the islands will take the Issue Driven route. That means, the issue, as it's defined, will dictate all following analyses, spatial or nonspatial. Creating a clear statement of the issue is your step number one.
When asked what the issue is, you can't just say "Watershed", or "Fire", or "Agriculture". I mean, you shouldn't, not that you cannot. Remember, the final priority map coming out of the spatial analysis is a visual representation of the defined issue. Think about how you would be explaining the map to a viewer. It wouldn't be nice to point to all the differently colored areas and use the same and only word "agriculture" as the description. You need something a lot more detailed, something like, "the red areas are the places with the highest priority where we should deploy our limited resources in order to protect our current food productions". Better?
Here, let's see a few good examples from the now famous Texas SWARS report.
* Central Texas woodlands conservation
* Sustainability of forest resources in East Texas
* Reduce the impacts of land-use change, fragmentation, and urbanization
* Moderate the impacts of catastrophic events
* Protect and improve air quality
To help you "choose and determine" and possibly "define" the issues, take a look at the big umbrella of the national State and Private Forestry (S&PF) themes and objectives.
S&PF National Themes and Objectives
1. Conserve Working Forest Landscapes
1.1 Identify and conserve high priority forest ecosystems and landscapes
1.2 Actively and sustainably manage forests
2. Protect Forests from Harm
2.1 Restore fire-adapted lands and reduce risk of wildfire impacts
2.2 Identify, manage, and reduce threats to forest and ecosystem health
3. Enhance Public Benefits from Trees and Forests
3.1 Protect and enhance water quality and quantity
3.2 Improve air quality and conserve energy
3.3 Assist communities in planning for and reducing wildfire risks
3.4 Maintain and enhance the economic benefits and values of trees and forests
3.5 Protect, conserve, and enhance wildlife and fish habitat
3.6 Connect people to trees and forests, and engage them in environmental stewardship activities
3.7 Manage and restore trees and forests to mitigate and adapt to global climate change
*source: NAASF Guide for Statewide Forest Resource Strategies (July 21, 2009). p.13
Monday, August 24, 2009
SWARS Spatial Analysis, The Book (2)
The Start...
The difference between an experienced GIS Analyst and a GIS technician, in my view, is that a technician does mostly the mechanical work as told to, while an Analyst knows how to create a complete solution in order to answer a question. Well, that has not much to do with the "Core Purpose" of this document, but it is something you should think about if you want to advance forward personally.
To conduct the spatial analysis for SWARS successfully, and to make your job as the GIS specialist a bit easier along the way, you should and need to get involved early in the process instead of shying away.
A good place to start is to get a clear understanding of what SWARS is about. I listed a number of websites from other states' SWARS projects in this blog post. Check out a few of those. Read how they described SWARS. Yes, these are not the most interesting page-turners. But believe me, the exercise is quite helpful.
Great Information from Ron
Our wonderful workshop host and great friend Mr. Ron Cannarella has posted an excellent comment here. It was such a good comment that I must move it into a new post. So, here it is. Also, please do visit the Hawaii SWARS site for more valuable information.
************ Original Comment from Ron *******************
Aloha All; Ron from Hawaii sending my regards. I'm sorry that missed you guys for the end of the workshop. I got the flu on Wednesday and was sick for a week. But I am fine now and on vacation in New York (and working on SWARS at the same time).
Yesterday I discovered these incredible resources created by the Northeastern Foresters Association (the equivalent of our WFLC, but for the northeastern states). They have compiled an impressive set of guidelines for producing SWARS.
Their main website is http://www.northeasternforests.org/FRPC/.
Two of the most valuable documents on that site are 1) a guide for producing your SWARS
http://www.northeasternforests.org/FRPC/files/1248201969NAASF_NA_Guide_State_Strategy_7_21_09.pdf
and 2) a checklist of important tasks that must be completed when producing your SWARS
http://www.northeasternforests.org/FRPC/files/1242272787DRAFTApproval_Checklist_4_State_Assess_Strategy_5-1-09.doc
Even though these documents are under the section called "Regional Documents" they are exactly what every one of us working on our SWARS needs to help us organize our projects.
I urge you to print out these two documents and read them very carefully before you go any further.
In particular, the first document gives three excellent examples of different ways of organizing your project; one example focusing on priority issues such as "agroforestry" (issue-driven, not spatial), and two examples focusing on specific places such as an important river (spatially driven). The examples of the analysis tables will be very useful to help to organize your issues. Our SWARS can be a combination of these two ways of organizing our thoughts; by issue and/or by place.
If you spend one hour reading and discussing these documents today, it may save you many hours in the months to come. I know that in Hawaii we have spent hours and hours discussing how to organize our project. In some ways, it feels like we have been lost in the forest, going in circles. This document is like being given a compass and a map; we can use it to find our way home before June 18, 2010.
I have just begun to go through all of the other documents on this website, and will report back on any of the other gems found there.
All the best, Ron Cannarella, Honolulu, Hawaii
Friday, August 21, 2009

SWARS Spatial Analysis, The Book (1)
Before we talk the techy stuff...
Rarely is there a GIS task that can only be solved by one method, or THE METHOD. When multiple choices are presented, it's hard to judge, if not impossible, which choice is definitively better. Whatever works better for you, however, is the one that you feel more comfortable with. This is a same point I just can't stop making ever since the first time I taught a GIS lab as a graduate student many years ago. There are a lot of materials floating out there on how to conduct the spatial analysis for SWARS. The procedure provided here is just one of the many that should lead to the same conclusion. It is designed mostly based on an observation of the average GIS capacity available in the Pacific region today. Foolish would it be to claim the method here is any superior than others. Neither is it wise to strike down this document as being worthless. In the end, the goal is to complete the SWARS spatial analysis, one way or another but accurately as the driving issue dictates. And that, is all that matters.
Rarely is there a GIS task that can only be solved by one method, or THE METHOD. When multiple choices are presented, it's hard to judge, if not impossible, which choice is definitively better. Whatever works better for you, however, is the one that you feel more comfortable with. This is a same point I just can't stop making ever since the first time I taught a GIS lab as a graduate student many years ago. There are a lot of materials floating out there on how to conduct the spatial analysis for SWARS. The procedure provided here is just one of the many that should lead to the same conclusion. It is designed mostly based on an observation of the average GIS capacity available in the Pacific region today. Foolish would it be to claim the method here is any superior than others. Neither is it wise to strike down this document as being worthless. In the end, the goal is to complete the SWARS spatial analysis, one way or another but accurately as the driving issue dictates. And that, is all that matters.
Thursday, August 20, 2009
How we did a accuracy assessment
Yesterday, I wrote up the accuracy assessment method we used for a landuse/landcover change detection project we used to do. Figured that some of you have been asking how to conduct an accuracy assssment, I'm putting it here. Might be of some use.
**************************************************************************
Accuracy Assessment for the Change Detection Program
A Brief Description
Zhanfeng Liu, zliu@spf-davis.info
Sampling Method
* Stratified Random Sampling
Reference Data
* Aerialphotography (color, hardcopy)
* Digital flight photos
* DOQQ
Results
* Standard Error Matrix Analysis
o Overall Accuracy
o Omission Error/Producer's Accuracy
o Commission Error/User's Accuracy
* ** Be noted that theoretically speaking, the Standard Error Matrix was designed for a Simple Random Sampling, therefore when applied to data obtained via a Stratified Random Sampling could produce biased estimates.
Procedure
1. Sample sites and polygons for the accuracy assessment were generated based on stratified random sampling strategy using a customized ArcView program . (manual for the ArcView 3.2 extension -- ACCP) The ArcView ACCP Extension was later implemented in ArcGIS 9.1.
2. For a sample site where reference data existed in digital format, the reference image was clipped out using the sample site polygon (location shift performed when necessary based on visual inspection). Then, canopy coverage was estimated using the ForestEye software.
3. For a sample site where reference data existed in hardcopy aerialphotography, the sample polygon was first printed onto a mylar sheet which was then used to pin-point the site on the aerial photo. Canopy coverage was estimated using a measurement grid system specifically designed for the project.
4. Canopy coverage estimates were input into a customized MS ACCESS database which could automatically calculate all the standard error matrix results.
Read the Original document page here.
Wednesday, August 19, 2009
a Step-by-Step Guide for SWARS Geospatial Analysis
As promised, I'm starting to put together this step-by-step guide for conducting the spatial analysis for SWARS. This will be a very detailed and technical guide designed for you GIS specialist. Because of that "high requirment", it's not gonna be ready in a day or two. Plus, I will have video clips to accompany some of the steps. So, read along as new writings become available here or on the page desiganated for the document here: http://docs.google.com/View?id=dg4763rp_42hf45563n.
I don't think you would need this document to be completedly available to start your work on SWARS, especially after the intense training last week in Honolulu. You should have learned enough to get started.
As I said more than a million times, there is a lot of work needed to be done before you even start to prepare your first layer. Defining the issue(s) alone will take some lengthy discussions sand debates. Then the layer rankings and weights, the class values for your rasters and how to get your original layers, continuous raster or themaic vector, all these questions are to be answered first.
Hoptefuly our repeated practices in the workshop on all that tasks have prepared you for the coming battles. Don't be shy! You need to and should be active in those meetings and discussions. You need to help to initiate, facilitate, and lead some of the discussions. Don't forget, in the end, you are responsible to implement all the anlyses. Without a well defined path and target, you could run into all kinds of problems later on. If that happens, yourself is partially to be blamed.
Sunday, August 16, 2009
What if?
What if you can have just one Model, an actual "model" you build in ArcGIS Model builder, that can handle the entire SWARS geospatial anaysis process from the very begining to the very end without need your intervention?
Would you like to have such a model?
Would you like to have such a model?
Thursday, August 13, 2009
SWARS Spatial Analysis Work Flow
Now, it's finally the time to give you what you all have been asking for, enjoy!!


** use this as a guideline, be flexible!
Tuesday, August 11, 2009
Hawaii SWARS Workshop Day 2
Did I say yesterday that the workshop was gonna get more intense? There you had it! What say you?!
Congratulations to everybody! If you survived today, it's gonna be a very smooth ride for the rest of the week. Indeed, all of our participants did a great job. Congratulations!
I have repeatedly said that, for this SWARS analysis, the actual model building and running are probably the least you should be concerned about. Those tasks are very mechanical and straightforward. Tools are already provided by ArcGIS. All you need to do is to fill in the blanks. The real challenge, for us the GIS specialists, is to get the input layers ready.
And getting all the input layers ready, from whereever the starting point is, can be a very long, boring, tedious, and frustrating march. You should see why that is now already after today. Did you not?
Having a thorough understanding of this data preparation process as well as all the techniques involved is absolutely critical. Only by truly understanding the process can you then be able to conduct the actaul SWARS analysis on your own, and handle any but definitely will occur "variations" along the way.
Let's review a few key points here:
- The ISSUE will dictate what layers should be used and how they should be ranked. Therefore, having a clear and well refined definition of the issue is the first crucial step!
- How a layer should be used to address a particular issue should be carefully studied. The same layer could be used completedly differently depending on the issue. For example, the same slope layer, should you give the maximum value to areas with slope greater than 45 degrees or areas with slope <>
- You could use the exact same set of input layers for different issues but have not only very different layers weights but also different value classification/scheme for the individual raster layers.
- Selecting the raster value classification/scheme is a quite subjective task. Say you need 5 values. You can use (1, 2, 3, 4, 5), or you can use (10, 20, 20, 40, 50). But because what we are pursuing is the relative importance, these two seemingly very different value classifications/schemes should produce the same result, as long as we apply the same value classification/scheme across all the input layers.
- To go from the original vector shapefile or feature class to the model ready raster layer with the corerct value classification/scheme, you have more than just one way to achieve that. You could run the feature class to raster conversion first and then reclassfiy the raster into the slected value classfication/scheme; or you could first add the correctly value classfication/scheme to the feature class/shapefile's attribute table, and then run the feature class to raster conversion based on the values you already put in.
- It's always beneficial, and preferably, to create a "master" or "boundary" raster first that will cover and only cover your land area. This "master" raster should have the right Cell Size, Projection, and Spatial Extent. You will use this master raster to set your spatial analysis Environment which avoid many unnecessary errors. You can also use this master raster to fill in holes (NODATA cells) as well as mask out ocean cells after the model running.
Well, that's a lot to digest already.
Monday, August 10, 2009
Hawaii SWARS Workshop Day 1

It surely has been a very long day for a first day of this kind of highly technical workshop, especially for those who just flew in last night. But it surely can be called a very successful day for a first day of this kind of workshop, highly technical!
(pic.1: Lisa welcoming the group)

Special thanks to Mr. Ron Cannarella (pic.2) and his office for providing such a wonderful environment to host this workshop, and for the all the tasty coffee and snacks!
What we did? Well, after the brief but warm welcome from Lisa and Ron, and a very quick overview of the SWARS spatial analysis process from myself, we jumped right into the battle. Not much else to describe but everybody worked very hard.
Our speical guest Mr. Jamie Carter from NOAA Coastal Services Center joined us after lunch and gave a very nice presentation on a cool mapping project they are doing in the pacific region. Please visit the CSC website for more details.
A more detailed timeline was planned out and provided at the day end based on the assessment of where everybody was. Milestones/targets were set for each of the next 4 days. Yes, most of us got really tired already after this long day. Unfortunately, it might just get more intense...
Oh! Did I mention, it is always great to see all the old friends again!!

(pic.3: "super-charged students" from FSM still working hard after others already left)
Friday, August 7, 2009
special guest on Monday
Looks like we will have a special guest on Monday visiting the workshop. Maybe we will get a talk on a very interesting project they have been working on for the islands.
Looking forward...
Looking forward...
Tuesday, August 4, 2009
Preparing for the Honolulu SWARS Workshop
Hey, friends. The workshop is coming up soon next week. I am very excited and really looking forward to seeing you all again. You have done a lot of great work so far. Let's work together and get the SWARS thing done next week, sort of. :))
To help me better prepare for the workshop and make more effiicent use of this opportunity, I'd like to hear from you on thoughts and ideas for the workshop. Are there any specific questions and issues you want to have addressed? Are there any specific techniques or tools you want to learn in ArcGIS? Do you have any other GIS related questions at all?
Well, inspired by our friend Mr. Ron Canarrela's wonderful work with the latest web/multimedia technology, I'm starting this blog just for our island projects. This should provide a better platform for improving communications.
To make clear, this is more of a personal effort, thus nothing here should be seen as official opinion from the USDA Forest Service or my direct employer GDIT. Hey, but on the other hand, we can keep it loose and express more freely, just like chats between friends.
All and any comments and ideas and questions are welcomed!
"Smiley Face" Label Tool for American Samoa
I retooled the Smiley Face label tool just a little bit to suit the need for our American Samoa partners.
Getting to know satellite imagery
this is a talk from our previous island workshops on Satellite Imagery.
Quick Demo of Definiens Developer 7.0 (eCognition)
We recently got the latest version of Definiens Developer 7.0, previously known as eCognition. It's the weapon we use to create polygon segements from the island QuickBird imagery. Here is a quick video demo of how the segmentation is done.
SWARS sites
I'm trying to find other states' SWARS information but the search has NOT been very fruitful so far. But here are a few available today.
National: http://www.ncforestassessment.com/pdf/assessment_strategy.pdf
Texas: http://txforestservice.tamu.edu/uploadedFiles/Sustainable/assessment/TexasStatewideAssessmentForestResources--Draft--26-Sep-2008.pdf
Hawaii:
http://www.hawaiistateassessment.info/about-this-site/
Northeastern Area: http://www.northeasternforests.org/FRPC/
South Carolina:
http://www.state.sc.us/forest/scfra.htm
Idaho:
http://www.idl.idaho.gov/bureau/ForestAssist/safr_index.html
Kentucky:
http://www.stateforesters.org/node/1374
Alabama:
http://www.forestry.state.al.us/Publications/TREASURED_Forest_Magazine/tfspring09/Statewide_Assessment_and_Strategy_for_Forest_Resources.pdf
Indiana:
http://www.in.gov/dnr/forestry/5436.htm
Oklahoma:
http://www.forestry.ok.gov/Websites/forestry/Images/Assessment%20and%20Strategy,%20Overview.pdf
Tennessee:
http://www.tn.gov/agriculture/publications/forestry/assessment.pdf
Notes for Hawaii SWARS Workshop
Simplify
Keeping it simple should be the principle #1 for any spatial analysis including SWARS. There is no reason to be overly concerned about how many value classes you should have for an input layer or if you should assign weight 28 vs. 25 to it.
Keep it simple, really simple. Generate some results first so you can see what you could get. It's always easy to go back and fine-tune your process in this digital age.
Subjective Decision Making in Scientific Analysis
Many decisions need to be made during the SWARS process. For most of them, however, there is no "THE" right decision:
More Than One "Right" Choice of Technique
One "funny" thing about today's "advanced" software is that they often times offer "too many" choices. Many don't realize that the same result can be achieved using seemingly "different" tools. A great example here: Single Output Map Algebra vs. Weighted Overlay!
Keeping it simple should be the principle #1 for any spatial analysis including SWARS. There is no reason to be overly concerned about how many value classes you should have for an input layer or if you should assign weight 28 vs. 25 to it.
Keep it simple, really simple. Generate some results first so you can see what you could get. It's always easy to go back and fine-tune your process in this digital age.
Many decisions need to be made during the SWARS process. For most of them, however, there is no "THE" right decision:
- Which input layers to use, 12 layers or 15 layers?
- Which layers are more important than others?
- Exactly what weight should be assigned to a layer?
- How many value classes should a layer have and what are the values?
- How should be final overlay result be classified?
More Than One "Right" Choice of Technique
One "funny" thing about today's "advanced" software is that they often times offer "too many" choices. Many don't realize that the same result can be achieved using seemingly "different" tools. A great example here: Single Output Map Algebra vs. Weighted Overlay!
Subscribe to:
Posts (Atom)


